But Most Portfolio Systems Still Don’t Integrate It
TL;DR: Nine in ten investment firms use alternative data or plan to. But far fewer have it built into their portfolio system, where the portfolio analysis and decision making take place. Alt data is consumed through vendor portals, CSVs, or built into a single ticker model, so it is missing the one thing that makes it actionable: portfolio context. Alt data belongs as another input in your portfolio analytics system, present where and when you make your investment decisions.
Alt Data is Everywhere Except Your Portfolio System
Lowenstein Sandler's 2025 alternative data survey estimated alt data adoption at 90% of investment firms, up from 67% a year earlier. That number is likely higher today, since the trend showed no sign of slowing. Two thirds of respondents run budgets above $1 million for their alt data programs, a sizable investment for managers. They also found that 97% of managers use it alongside fundamental analysis rather than as a walled-off quant signal, implying that context matters a great deal for alt data to be actionable. Managers refer to their collection of alt data sources as a “Data Mosaic” and many use multiple providers and different sources of data to form their view.
Neudata counted 2,805 commercially available datasets in 2025, up from 2,215 the prior year, against roughly $2.8 billion in annual buy-side spend. An interesting finding in that report was the average dataset is now licensed by about 20 investment clients, down from 25 a year prior. The market is fragmenting rather than converging on a handful of datasets everyone owns, with each fund assembling their own unique data mosaic.
That fragmentation is both an opportunity and a challenge. Since the data is disparate and varies by format, frequency, source, etc., it means that each fund can add value in the way they combine and interpret the data. The problem is that your mosaic of datasets is specific to your process, so no vendor can give you the full comprehensive integrated view, especially when they are lacking any portfolio context. You either build that centralized system internally or buy a portfolio system that supports all your data as an input.
Most funds, with the exception of the largest and best resourced, have not built such a centralized system. Their workflow is (roughly) to log into a vendor portal, download a report or file and build some of it into their model. They also likely bring up an insight they found from the data at a meeting or an email to their PM.
Besides missing portfolio context, memory is another issue. After a few months go by, no one remembers what the alt data used to say on a particular name when it was sized with that data as an input. You’d have to go digging through the model or searching through sent emails to remember what the signal was.
Fragmentation of alt data is both an opportunity and a challenge. Since the data is disparate and varies by format, frequency, and source, each fund can add value in the way they combine and interpret the data.
Centralization is the Solution That Makes Alternative Data Actionable
We made the argument in What Is Your Portfolio Intelligence Missing: if information can impact an investment decision, it belongs in the system where that decision is made. Things like price targets, risk decomposition, research notes, consensus estimates are all critical inputs into sizing decisions. alt data is just another critical input that has to be weighed and considered in the context of all your other conviction metrics and risk measures.
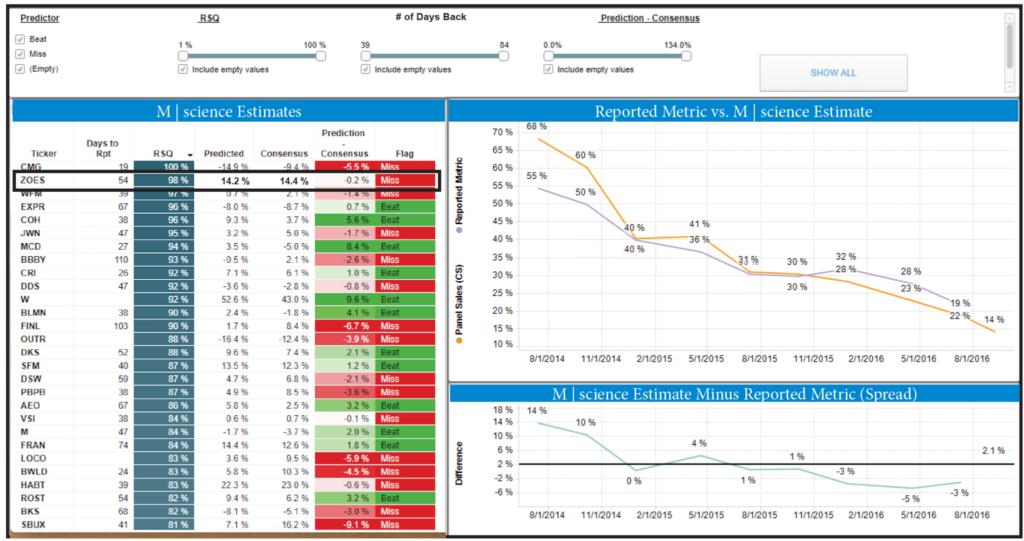
The system aggregates all the important alt data KPIs like vendor-specific trend scores, estimates, and predicted-versus-consensus spreads from data providers. They are presented in configurable columns in the same grid as price, exposure, internal price target, short interest, and factor loadings.
Columns are going to be different for each client based on what your firm licenses and who is entitled to see it. So traders, analysts, and PMs will get their own view of the data based on what they are entitled to.
- "This is why EDS treats alt data as another input, overlaid on everything else you already track, in a centralized system that remembers everything."
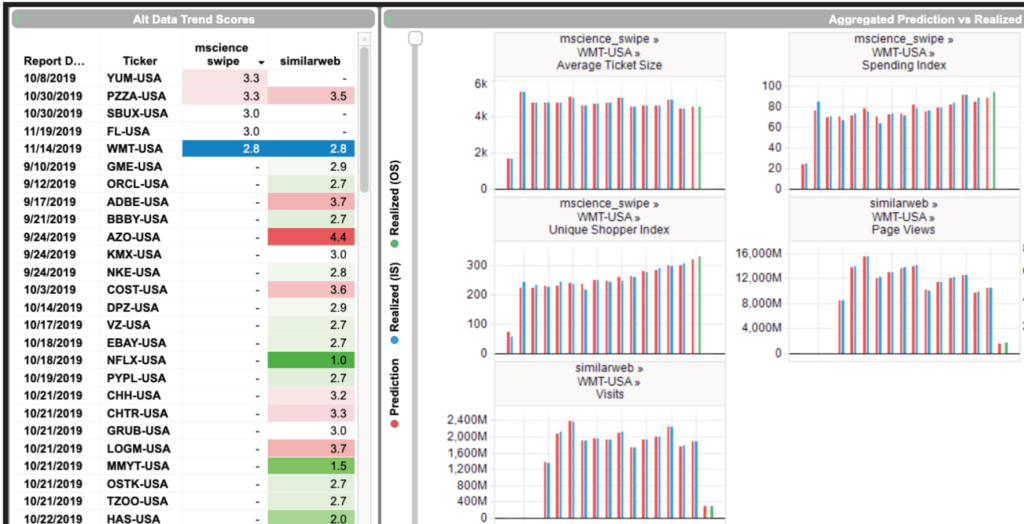
As far as analytics go, none of this is novel and similar charts can be generated in vendor platforms or inside internal models. The difference is that with EDS the signal shows up where the position is presented with its full context and right next to the numbers that determine what you do about it. This cuts down on chasing insights on different platforms and streamlines decision making.
Questions that Turn a Signal Into a Decision
Once alt data is integrated in the same view as the rest of the portfolio, a PM can ask the questions that matter to the decision without leaving the workflow:
- What is the risk of this position?
- What theme or factor bucket does it fall under?
- What is its contribution to portfolio VaR?
- What is its expected return and expected volatility?
- What does alt data say about the upcoming print?
- What does the market expect and how different is that from what my data indicates?
Now the questions can be answered from a single place. The beat you factored into your price target is now in the context of market expectations and the rest of your data.
Do Not Buy More Data Sets, Use the Ones You Have
Some managers will argue that alt data has limited alpha-generative potential as the edge degrades when most of the market buys the same data source. The edge is how you use that data and if it is truly integrated into your workflow. It is more of a process question: does the signal reach the decision with its context intact, or does it die in a spreadsheet somewhere between the vendor portal and the next investment committee meeting?
Take a look at how the world’s top managers integrate their data mosaic directly into their investment management process.
Try EDS for free →